Will the Bellingham Real Estate Market Crash?

Do you remember where you were on Monday, September 15, 2008?I do. I was in my office -- I worked at RE/MAX at the time.
The day before, I had an offer accepted on a house on Eldridge Drive, for a client we'll call "Noah".
Noah was an elderly, very savvy buyer who had carefully looked at half a dozen Bellingham houses with me. He was shopping for what would likely be his final real estate purchase.
Noah was acutely aware that the real estate market had softened since the peak in 2007, and was relatively unstable as we neared the 4th quarter of 2008.
But there we were, under contract on a house he quite liked. It was Day 1 of our inspection contingency.
I sat at my desk, pulling all the levers and assembling the team that one does with a new "Pending" purchase, all on Noah's behalf.The phone rang, it was Noah calling."Brandon," he said, in his serious, thick, Middle-Eastern accent. "Have you seen the news?"
I had. It was impossible to miss. Lehman Brothers, the 4th largest investment bank in the world, had just declared bankruptcy.
"Brandon," Noah continued, "terminate the contract at once. The world as we know it has just changed forever."
Noah was, of course, correct. Real estate prices in Bellingham and in most markets worldwide would decline in the years that followed, an era known by several different acronyms including the "GFC" -- Global Financial Crisis.
Locally, we wouldn't see an uptick in prices until 2012.Of course, we have now seen year-over-year appreciation since that uptick, vastly eclipsing the median sale prices from that 2007 peak.
Many people now, having experienced the greatest bull market since the dawn of humanity, justifiably ask:"
Are we in another bubble? Is the Bellingham real estate market going to crash?"
The smartest economists, hedge fund managers, bank presidents, CEOs, and the Noah's of the world are working to answer that exact question every day.
In this post, mid-July, 2021, let's explore it together.
First, let's revisit the past...
As you know, this latest, almost-decade-long run-up in prices is not the first time Bellingham has seen a rapid, significant appreciation of its real estate values.
I remember the last time like it was yesterday.Heather and I arrived here in August 2003. We had just spent the summer months sea kayak circumnavigating Lake Baikal in Siberia.
Bellingham, we had decided, would be our "new start" after a stretch of years consisting primarily of international adventure racing and months-long expeditions.
Our housing budget was limited... I think we qualified up to $180K or so... although at the time that was more than enough to get into a decent starter home.
Time and again we were beat out in multiple-offer scenarios. I remember a lot of tears and frustration before we finally scored that humble, fixer-upper of a first house in December '03.
While in escrow, the seller offered to sell us the vacant lot next door to the house for $14K. We didn't have an extra $140, much less $14K, so my mom and dad bought it.
Two years later they sold it, unimproved in any way, for $64,000. That was mid-bubble. At that time, everyone thought everything was going to go up, up, up, forever and ever.
Here's what prices did nationally -- Bellingham included -- from when my folks bought that lot until they sold it:

During the run-up depicted by the graph...
When a pricing graph looks like the one above for a period of years, enterprising people take action. Builders who realize across the board profits on onesie-twosie spec house projects decide to simultaneously try four, six, or twelve projects.
Real estate investors who can borrow hundreds of thousands of dollars with nothing more than verbally "stated income and assets" do exactly that, taking advantage of "maximum leverage" and "OPM" -- other people's money.
Remember "pick your payment" loans? Didn't do quite as well this month at work? No worries... just choose the "pay a small fraction" mortgage payment option, let the balance carry forward to a distant future date on that ever-ascending price graph, and you can avoid that pesky shortfall altogether.
(If you haven't watched it, DEFINITELY treat yourself to the movie "The Big Short." Shoot... just watch the trailer -- it's a wonderfully scored, artful summary of what I'm trying to convey here.)
A bubble is formed...
OK, so it's 2004, 5, early 2006...
prices are going up by the week, mortgages are being handed out like Halloween candy, buyers are buying not just one house, but grabbing a vacation home or two while they're at it.
To do it, many buyers are leveraging over a million in mortgage debt with their sub-prime credit score, "stated income", and little to nothing as a down payment.
These buyers' "default ratio" going into these purchases was at an extreme level. By that I mean, their monthly debt obligation (added to the need to eat food and buy gas) was wayyyy more than their ACTUAL income could safely cover in an ongoing fashion. (But hey, the lenders weren't really checking, so why not, right???)Let's recall another occurrence from that era: Cash at Closing.
Nowadays, the only person getting cash at closing is the seller. But back in the mid-2000s, if the home you were buying appraised for more than your contract price -- which happened almost every time if it was a pre-sale (new construction that you got under contract months before it was finished) -- you could just take that extra equity at closing in the form of CASH.(That is now called "lender fraud".)
And where did a LOT of that borrowed cash at closing ultimately go? Right here...

Inventory played a huge role...
With all the building going on during those mid-2000s bubble years, a vast surplus of inventory was created.
In August 2006, in Sudden Valley, there were 157 Active listings. (Today there are 8.)In Bellingham, there were 664 Actives. (Today there are 66.)And... Bellingham at the time had a total head-count of 75,000 people. (Today's it's over 90,000.)At any rate, with all those homes on the market, suddenly things shifted and began to taper. The price graph flattened as we entered and moved through 2007.It peaked in October 2007 then began a steady decline. It had been doing that for a year when Noah began carefully shopping and watching US and world news outlets closely.
Then, in September 2008 Lehman Bros. collapses, the piper comes calling, or, as Warren Buffett likes to say...

In the following years...
A lot of pain occurred in the years after the bubble burst.Nationally, median prices declined 34% between the peak and 2012. (In Bellingham median prices declined 13%.)Many short sales, many foreclosures, some indictments, some prison time. And a lot of people who swore off buying or owning real estate ever again -- despite that looking back now it was all so obvious.In many ways it feels very familiar to what we're experiencing today:
Multiple offers with escalation over list priceYear-over-year appreciation cresting 20%
A lot of very frustrated buyers, especially newer buyers trying to break in and compete, often against cashIncreased mortgage debt
New construction and increased building permits issued
Virtually EVERYONE is wondering if this is the same set-up as pre-Global-Financial-Crisis. It's a fair question.
Let's look at some then-and-now metrics and see what story they tell.
Metric #1: Supply & Demand
I shared earlier that Bellingham's inventory today is roughly 1/10th what it was back in 2006. Let's call that "supply".
"Demand" would be measured, then, in the actual number of sales from within that supply.
Let's look at June 2006 vs. June 2021.Bellingham, June 2006: 566 Active listings (average, per day), 117 sales total. That's 20.6% of available inventory selling that month.
Bellingham, June 2021: 55 Active listings (average per day), 107 sales total. That's 194.5% of available inventory selling that month.The graph below does a better job of illustrating it. Red is supply, Green is demand. The left side is peak of the pre-GFC bubble. The right side is today.

Metric #2: Quality of Mortgage Debt
Leading up to the GFC, there was a notable "erosion of lending standards" that resulted in sub-prime mortgages (loans made to people with <620 credit scores) making up a significant percentage of overall housing debt.
Translation: Banks were handing out loans to ANYONE.
The graph below shows the extent of sub-prime loans as a proportion of all mortgage originations. Sub-prime is shown by the dark blue bars on the bottom left of the graph.Then look to the right side, where sub-prime originations all but disappear, and loans made to borrowers with scores of 760 or higher (the light blue bars) are now dominant.

Metric #3: Mortgage Debt Vs. Equity
In the 24 months between January 2006 and January 2008, in Bellingham, 8.3% of sales were cash. A cash sale equates to a default-proof, 100% equity position.
In the previous two years ending today, cash sales have more than doubled to 19.2%.Full cash sales notwithstanding, nationally there is significantly more equity in the housing market than in the pre-GFC and mid-GFC era.
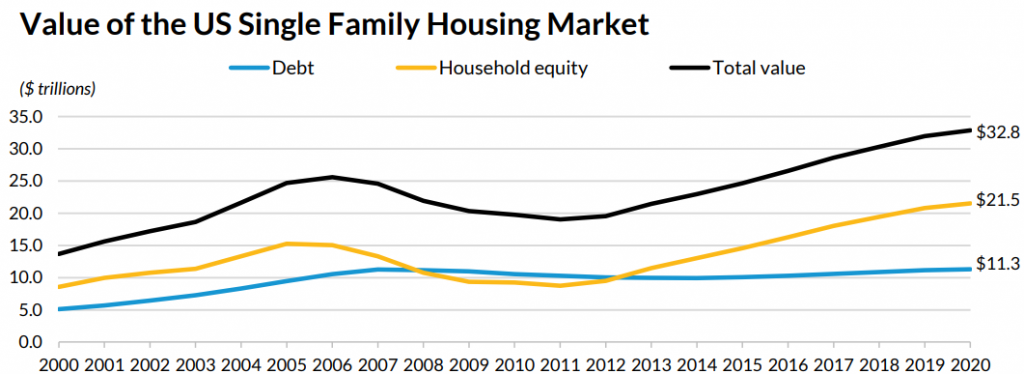
In the first quarter of 2008, there was $10 trillion in equity but also $10 trillion in mortgage debt -- an even split.
Today there is slightly more mortgage debt at $11.3 trillion, but the total equity is almost double that amount, over $21 trillion.
Here's a graph of debt (blue line) versus equity (yellow line) in US housing, from 2000 to the present.
Metric #4: New Construction Not Keeping Pace
I'm a regular reader of Lawrence Yun, chief economist of the National Association of Realtors.
Citing his data, construction of new homes met demand and therefore "normalized" in 2011.But as demand grew in the following years, builders did not keep pace. By 2015 there was a shortage of 2 million homes nationally.
By the end of 2020, the shortage had grown to 4.8 million homes. Considering the average US household size of 2.53 people, that equates to over 12,000,000 people living in rentals or with mom or dad who would otherwise be buying a new home.
Homebuilding activity in 2021 is expected to be slightly higher than historical norms, but nowhere near "high enough". If it remains consistent, it will take several years to meet current demand, or "normalize" as it did in 2011.Remember, though, there's another problem at play here:
CONSTRUCTION MATERIALS AND LABOR ARE EXTREMELY EXPENSIVE AND HARD TO COME BY.NOT TO MENTION LAND! (I promise that "Building in Whatcom County" will be the topic of a future newsletter.)NOT TO MENTION THE NEW ENERGY CODES ADDING, BY SOME ESTIMATIONS, NORTH OF $30K TO THE COST OF BUILDING A NEW SINGLE-FAMILY RESIDENCE.Reuters.com reported yesterday that housing permits dropped to an 8-month low -- a definite bad sign for an already constrained supply. The reason cited in that article? Builders simply can't afford -- or can't even find -- the materials and labor right now.
So What's My Answer?
Q: Is the Bellingham real estate market going to crash?
A: No.
I mean... did the market even "crash" during the Global Financial Crisis? Is -13% a crash?
In the first week of September 2008, Lehman Bros. stock dropped 77%.On September 11 it dropped another 42%.On Monday, September 15 it fell a final 93%.THAT is a crash.
Even the national decline of real estate prices of 34% during the GFC could reasonably be called a crash.
But the Bellingham market has so much pent up demand and so little inventory, along with so little opportunity to actually solve that inventory shortage, that -- while we WILL certainly see a tapering, a softening in the market in the years ahead -- unless Mt. Baker blows its top half or a tsunami of epic proportions rumbles up the Frasier River Valley...Gosh... even then. It would just force all the north-County residents to an already-impacted and topographically more protected Bellingham proper. (Geologist friends, correct me if I'm reading that wrong.)
What Other Factors Are At Play?
There are many factors and variables that I didn't even touch on in this short piece.
The amount of liquidity in the market, which has of course caused...
The high rate of inflation, and will lead to...
The (impending) increase of interest rates to slow inflation, caused by...
Government interventions.
Oh, and... Many, many other forces too vast for this article.
I could continue writing this analysis for a month! I love studying it and reading the endless reports written by people far smarter than me.
I also love sharing what I've learned -- along with my opinion. I'll leave you with exactly that, my humble opinion, below. And I will, of course, see you again in two weeks!
