The relief held: the average 30-year fixed mortgage rate fell for a second straight week, to 7.24% from 7.32%.
That is its lowest level this month, and two weeks of small drops now add up to 0.16 points below the 7.40% plateau that held through early October.
The 10-year Treasury yield kept sliding and ended Friday at 4.94%, its lowest close this month.
The Fed held its benchmark rate steady on Wednesday, exactly as expected, but two committee members wanted another hike.
Thursday's data showed why: the Fed's preferred inflation gauge came in hot again for September.
This Week's Numbers
These are the same numbers every Monday, so you can see the pattern build over time.
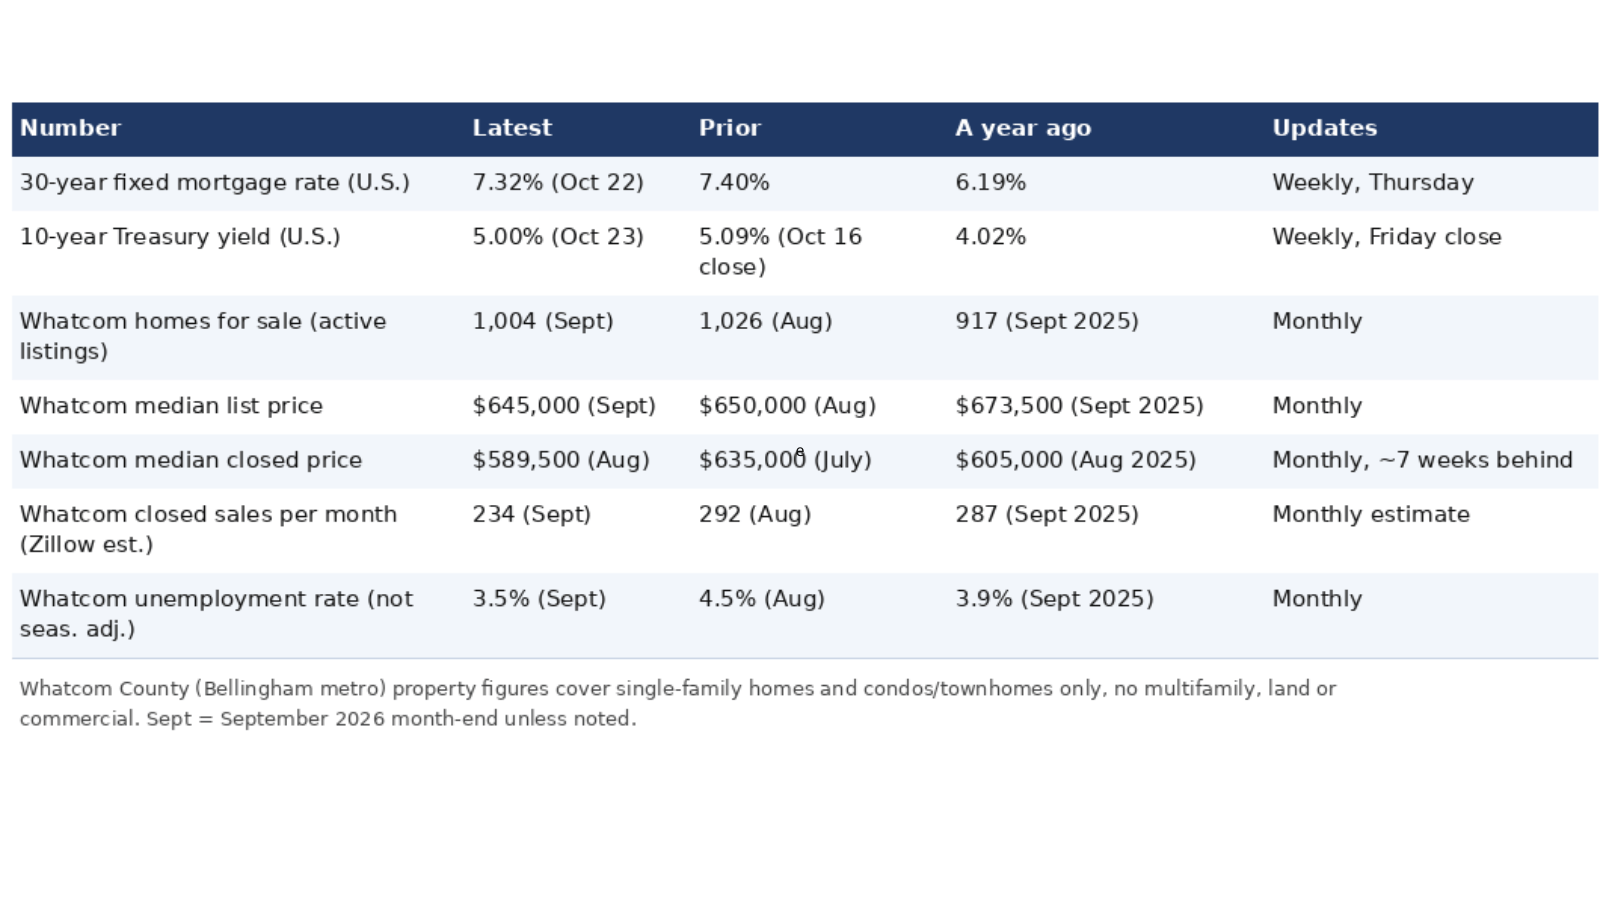
All property numbers cover single-family homes and condos/townhomes only (no multifamily, land or commercial).
Local numbers cover the Bellingham metro area, which is all of Whatcom County.
Listings and list price show what sellers are asking, and the two closed-sale rows show what homes actually sold for, with a lag.
What The Numbers Say
Rates.
A second straight weekly decline, giving back another 8 basis points to 7.24% as it followed the 10-year yield down.
Yields.
The 10-year yield's weekly average fell for a third straight week, from 5.15% to 5.07% to 4.99%, and Friday's 4.94% close was the lowest of the month.
Inflation.
The Fed's preferred gauge, the PCE price index, rose 3.6% in September from a year earlier, up from 3.4% in August, with the core reading at 3.1%.
Growth.
The economy grew 3.4% in the third quarter, stronger than expected, which gives the Fed room to wait and gives its hawks ammunition.
Jobs.
Nothing new locally: September's 3.5% unemployment rate still stands, and October's reading arrives in the middle of the month.
Inventory and closed sales.
Still no new local reading, since the monthly files update after month end, so September's 1,004 homes for sale and estimated 234 closed sales stand for a few more days.
How These Numbers Connect To Your Mortgage Rate
Mortgage lenders watch the 10-year Treasury yield when they price most fixed home loans, though it is not the direct benchmark for every loan.
Investors who buy mortgage bonds compare them to Treasuries, so when the 10-year yield moves, mortgage rates follow.
Lenders then add a cushion on top, usually around two percentage points.
This week that gap was about 2.25 points (a 7.24% mortgage rate versus a 4.99% weekly average yield), the same cushion as last week, and the drop in your rate tracked the drop in the yield.
Over the last ten years that gap has averaged about 2 points, so this week's reading sits close to the usual range.
Jobs and inflation sit behind the yield.
This week the yield kept falling even with fresh hot inflation data, which I read as bond traders still expecting the Fed to bring inflation back down over time.
Our local unemployment rate works differently.
It does not move mortgage rates, which are set nationally.
It tells us how confident and how able Whatcom buyers are, and September's bounce back to 3.5% says our local buyer pool is on steadier footing than August suggested.
So I watch the national numbers to see where your rate is going, and the local numbers to see how our buyers will handle it.
What This Means For Buyers
The math keeps moving in your direction, slowly.
On a $645,000 home with 20% down, the monthly principal and interest payment is about $3,517 at 7.24%, roughly $28 less than the same quote a week ago.
Two weeks of drops have trimmed about $56 off the early-October quote.
At last year's 6.17% the payment would be about $3,150, so the gap to a year ago is still roughly $366 a month for the same house.
If you are writing an offer soon, a fresh pre-approval shows your budget at today's lower quotes, and your lender can tell you when a rate lock becomes available, usually after an accepted offer.
What This Means For Sellers
Every bit of rate relief brings sidelined buyers back into the pool, and two straight weeks of relief is starting to look like a trend.
The closed numbers still tell a cautious story: September's estimated 234 sales were down 18.5% from a year ago, and the median closed price sat under $600,000 in August.
Homes priced to today's payment reality still get attention, and this month's rate drift works in your favor.
If you are thinking about selling before the holidays, price against today's rates, not last spring's, and expect to negotiate.
What The Fed Is Saying
Freddie Mac's chief economist Sam Khater kept it simple on Thursday: the 30-year rate "declined again this week, reaching its lowest level this month and modestly boosting purchasing power for prospective buyers."
The bigger voice was Wednesday's: the Fed held its benchmark rate at 3.75% to 4%, but the 10-2 vote was not unanimous, and two members wanted to raise instead.
Thursday's numbers explained the split, with inflation at 3.6% on the Fed's preferred gauge and the economy growing 3.4%.
Fed Chair Kevin Warsh called the stretch ahead "information rich" and said he and his colleagues are keen to take notice of it.
A split vote is not a hike, but it tells you the inflation fight is not finished.
What I'm Watching Next
This week: the October listings file, to see whether September's 1,004 homes for sale was the high-water mark for the year.
Thursday, November 5: the next mortgage rate reading, to see whether the two-week decline becomes three.
Mid-November: October's local unemployment reading, after September's encouraging drop back to 3.5%.
December 8-9: the Fed's last meeting of the year, where the hold-versus-hike debate resumes.
If you are thinking about a move this fall, schedule a 15-minute call and we can look at your numbers together.
Sources for reader review
Freddie Mac Primary Mortgage Market Survey (weekly 30-year rate) and the October 29 rate release with Sam Khater's comment
Federal Reserve, October 28 FOMC statement and Chair Warsh's press conference transcript
CNBC coverage of September PCE inflation and third-quarter GDP
Washington Employment Security Department, Whatcom County profile (September unemployment)
Realtor.com Research, Whatcom County market data (listings and list prices)
U.S. Bureau of Economic Analysis, Personal Income and Outlays, August 2026 (August PCE comparison)
Property numbers cover single-family homes and condos/townhomes only.